
Bitcoin fell to $67,500 on Friday, November 13, 2026, slipping below its 200-week simple moving average of $67,993. The original report described it as Bitcoin’s first test of the trend line in nearly three months, after a previous touch on August 19.
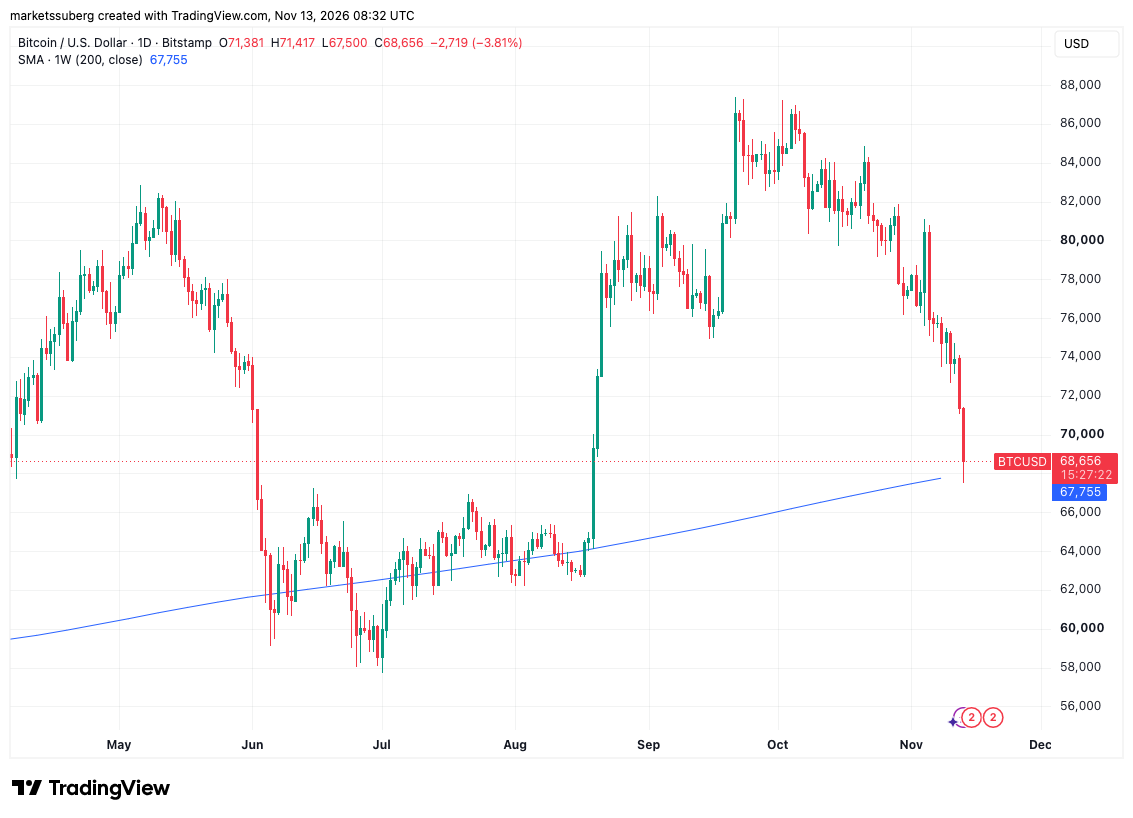
The 200-week average has been a reference point for Bitcoin’s cycle lows, but a test of the line does not determine what happens next. Bitcoin traded around it from March to October 2023 and again from June to mid-August 2026. Moves decisively back above it on the weekly chart have preceded sharper rallies in the past.
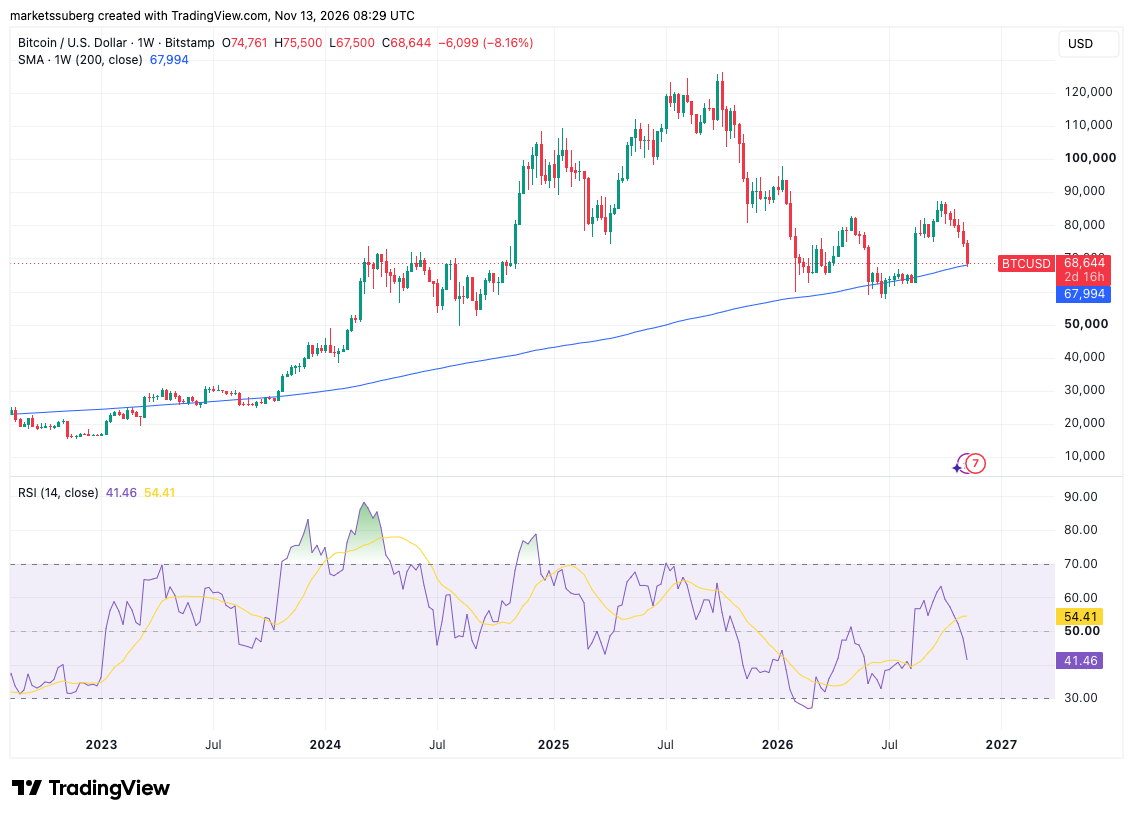
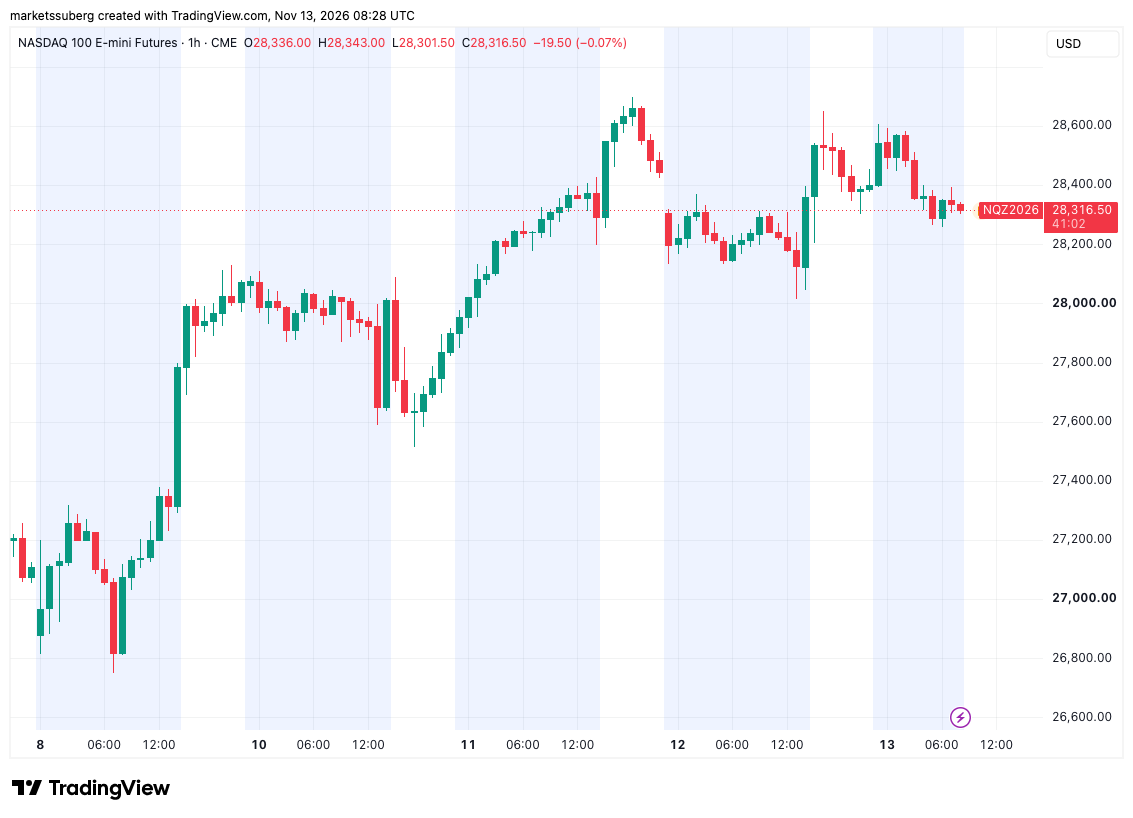
Material Indicators co-founder Keith Alan also pointed to Bitcoin’s weekly relative strength index, or RSI, which had returned to 41.5. He said a drop below that level could open the door to a retest of the cycle low near $57,700. He also noted the bullish implications if the support zone held. Those were conditional scenarios, not confirmed price moves.
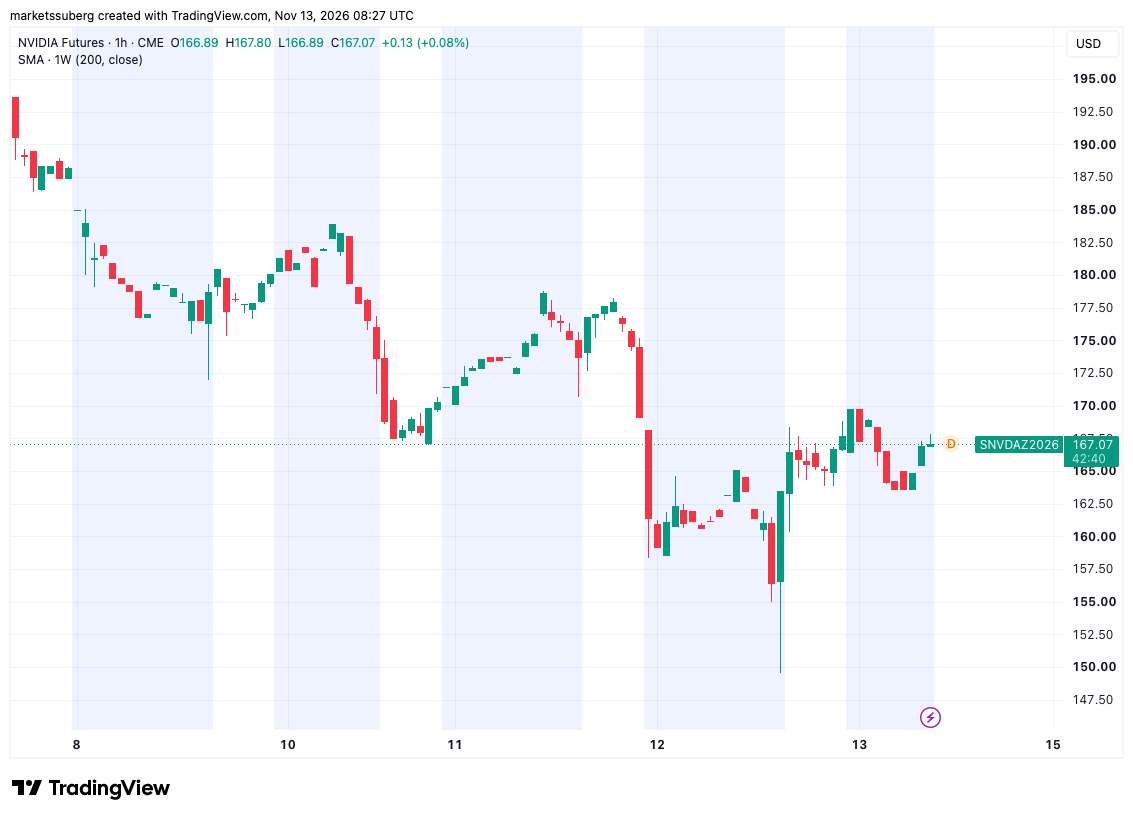
Stocks were under pressure the same day. Cointelegraph reported that Asian markets were reacting to Nvidia CEO Jensen Huang’s resignation and the surrounding controversy: Hong Kong’s Hang Seng closed down 1.55%, South Korea’s KOSPI fell 0.98%, and Nasdaq-100 futures were down 0.2%. Nvidia shares were 0.7% higher in premarket trading amid reports of support for Huang’s return. The report placed Bitcoin’s decline alongside those moves; it did not establish that the Nvidia news caused it.