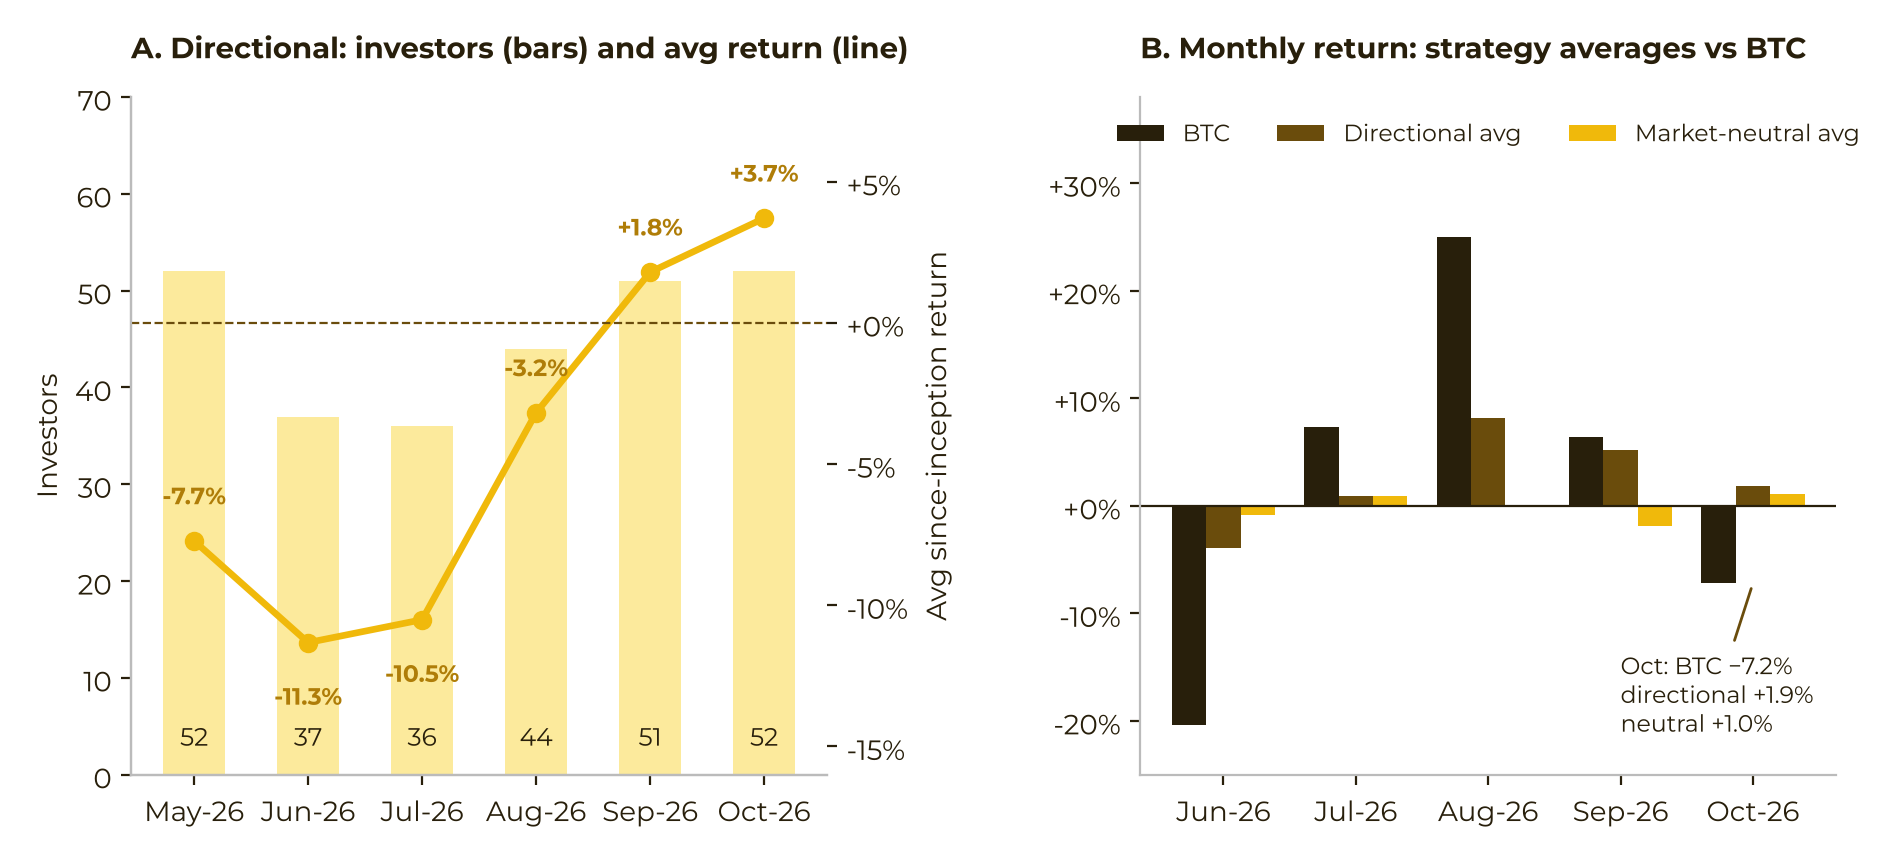
In October 2026, Bitcoin fell 7.2%. On Binance’s Capital Connect platform, directional crypto funds still posted a simple average monthly return of +1.9%, and market-neutral funds averaged +1.0%. That monthly test is not the larger gap in the Binance Research note.
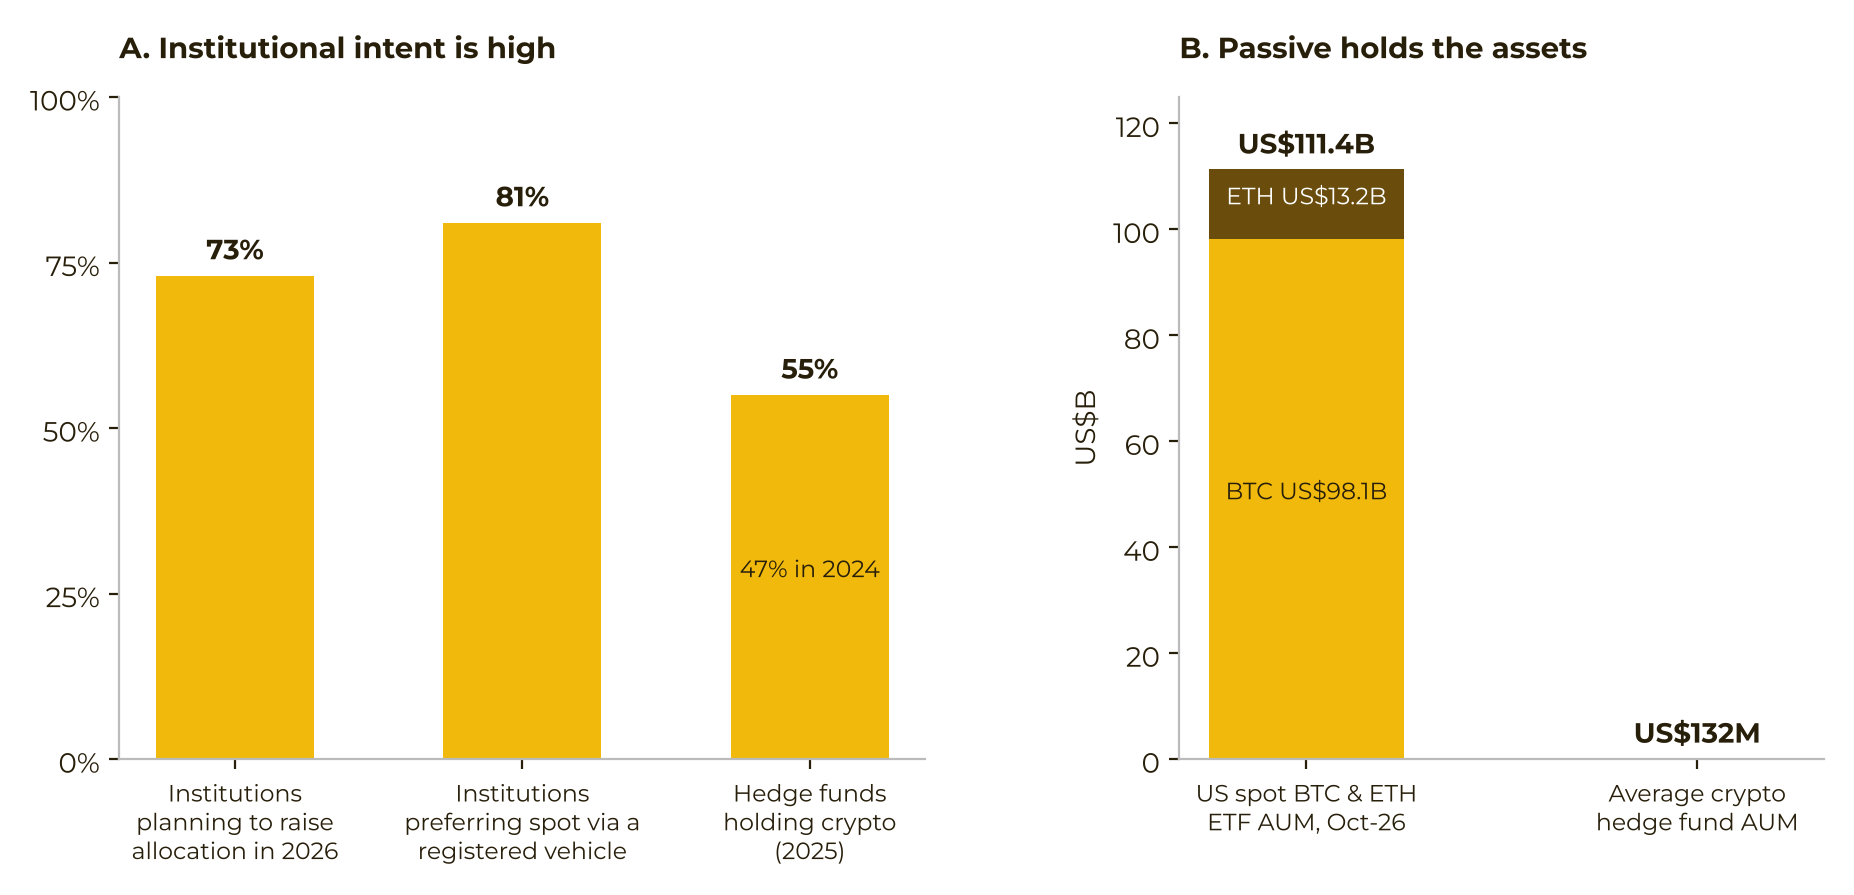
As of 31 October 2026, US Bitcoin and Ethereum spot ETFs held about $111 billion combined. Crypto hedge funds, by contrast, averaged $132 million in assets, and 91% were under $1 billion. Kim Lim and Jasper Jin of Binance Research, carried in Chinese by TechFlow on 11 November 2026 at 19:55 UTC+8, argue that institutional money had entered digital assets while active management had not scaled. The note is a snapshot through 31 October 2026, plus the platform’s first direct interviews with allocators and managers, conducted from 29 October to 1 November 2026. It is not a call on a cycle top or bottom.
Original report: TechFlow, 11 November 2026, 19:55 UTC+8.
Passive wrappers took the institutional bid
Allocation intent, on the surveys Binance Research cites, was already firm before that October print.
An EY-Parthenon and Coinbase survey from 2026 found that 73% of institutions planned to raise their digital-asset allocation that year. An AIMA and PwC report found that 55% of traditional hedge funds already held crypto assets, up from 47% in 2024. Among the institutions surveyed, 81% preferred registered, compliant products for spot exposure.
Position size stayed small even where crypto was owned. Among traditional hedge funds that held crypto, more than half allocated less than 2% of total assets. At the same time, 60% of institutions planned to lift exposure above 2% within a year. The report reads that pair of figures as interest constrained by infrastructure, not as a lack of interest.
Binance Research’s own conclusion is that the ETF-versus-hedge-fund split reflects a market-structure gap, not a shortage of manager skill. Spot ETFs scaled, in that account, because they arrived as a full institutional package: custody, audit, daily net-asset-value pricing, and reporting allocators already knew. Active crypto strategies had not offered the same degree of institutional integration. The authors also say capital stayed in beta exposure less by active preference than because an effective distribution layer was missing. Capital Connect, which the note describes as Binance’s regulated discovery and allocation platform for crypto funds, is presented as an attempt to fill that layer. That is the report’s framing, not an independent verdict on the platform.
Discovery is the stated bottleneck, not a missing manager class
The note’s comparison with traditional finance is about search channels, not about repeating a prior price cycle.
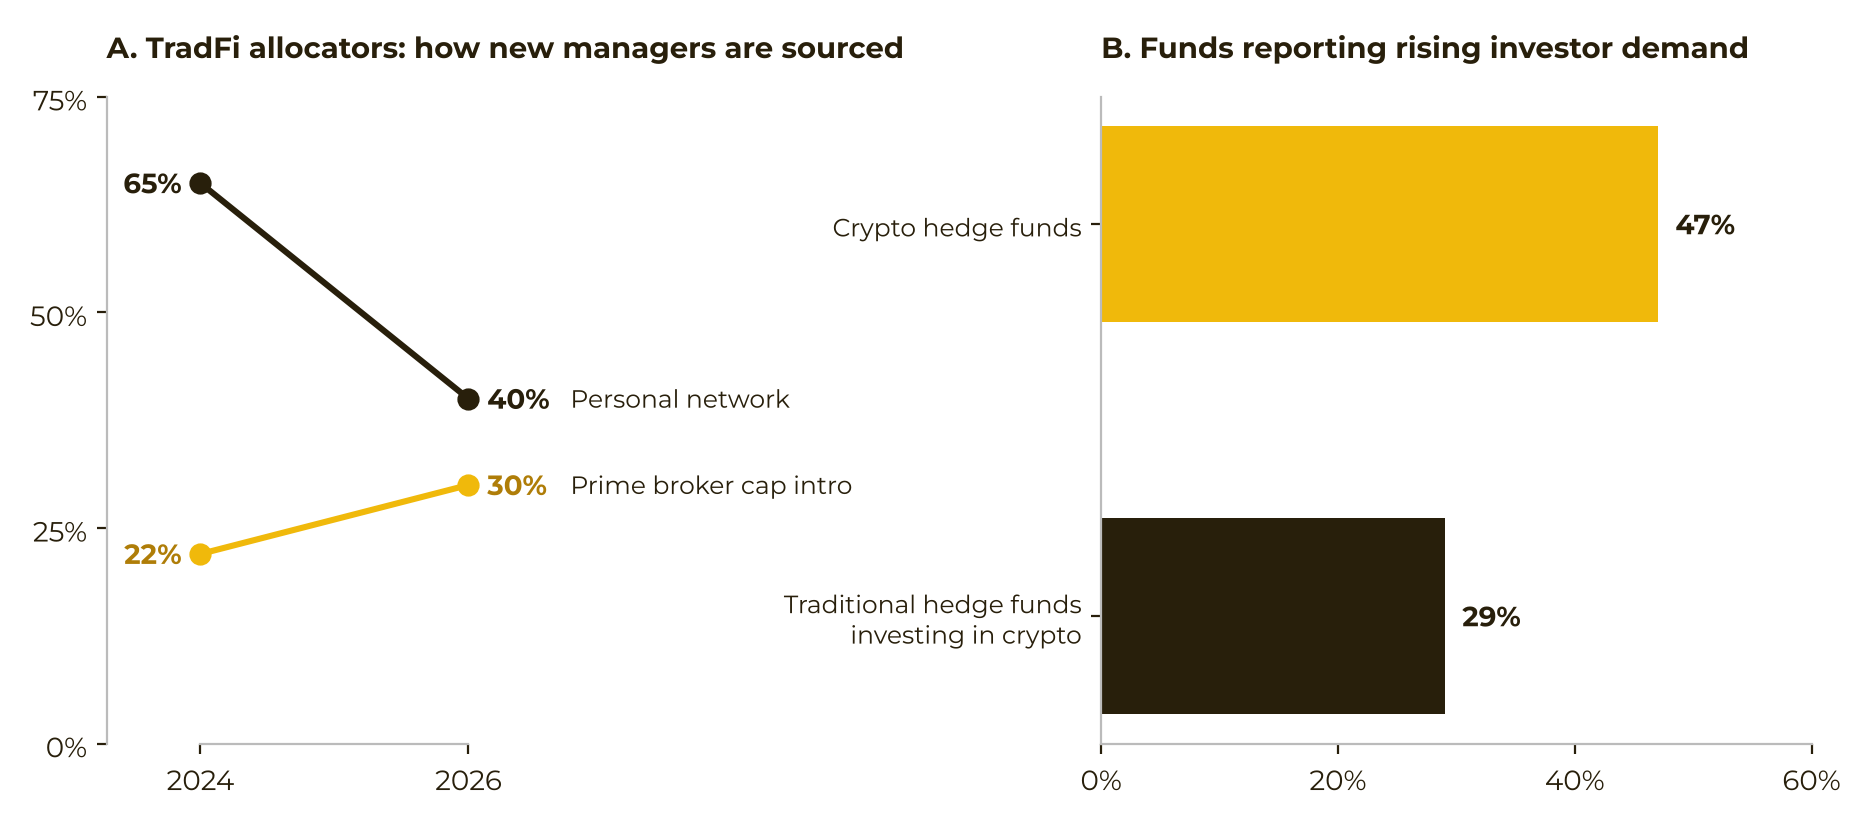
AIMA and Marex found that allocators’ reliance on personal networks fell from 65% in 2024 to 40% in 2026, while capital introduction through prime brokers rose from 22% to 30%. Crypto, the authors write, still lacked an equivalent standard path. Allocations still leaned on Telegram groups, offline conferences, and personal referrals. Without a common performance-disclosure and benchmark frame, investors could not compare managers on the same terms, and institutions struggled to check audited financials, custody arrangements, and service-provider credentials.
Those frictions cut both ways. Among crypto hedge funds, 47% said investor demand was rising, against 29% of traditional hedge funds that had moved into crypto assets. Family offices and high-net-worth individuals remained the main backers. Only one-fifth of crypto hedge funds listed pensions, endowments, or sovereign wealth funds as a primary investor type, though that share was up from one-ninth a year earlier.
The similarity with traditional markets is that allocators were trying to institutionalize how they find managers. The difference is that crypto’s discovery, verification, and benchmarking layer was still described as close to blank, while the passive channel was already built out.
On a disclosed platform, count and capital pointed opposite ways
Capital Connect is used in the note as a window where strategies are publicly disclosed and results are measured on one standard. October continued an earlier pattern. The report says a transparent discovery layer does not create allocator preference; it makes that preference visible.
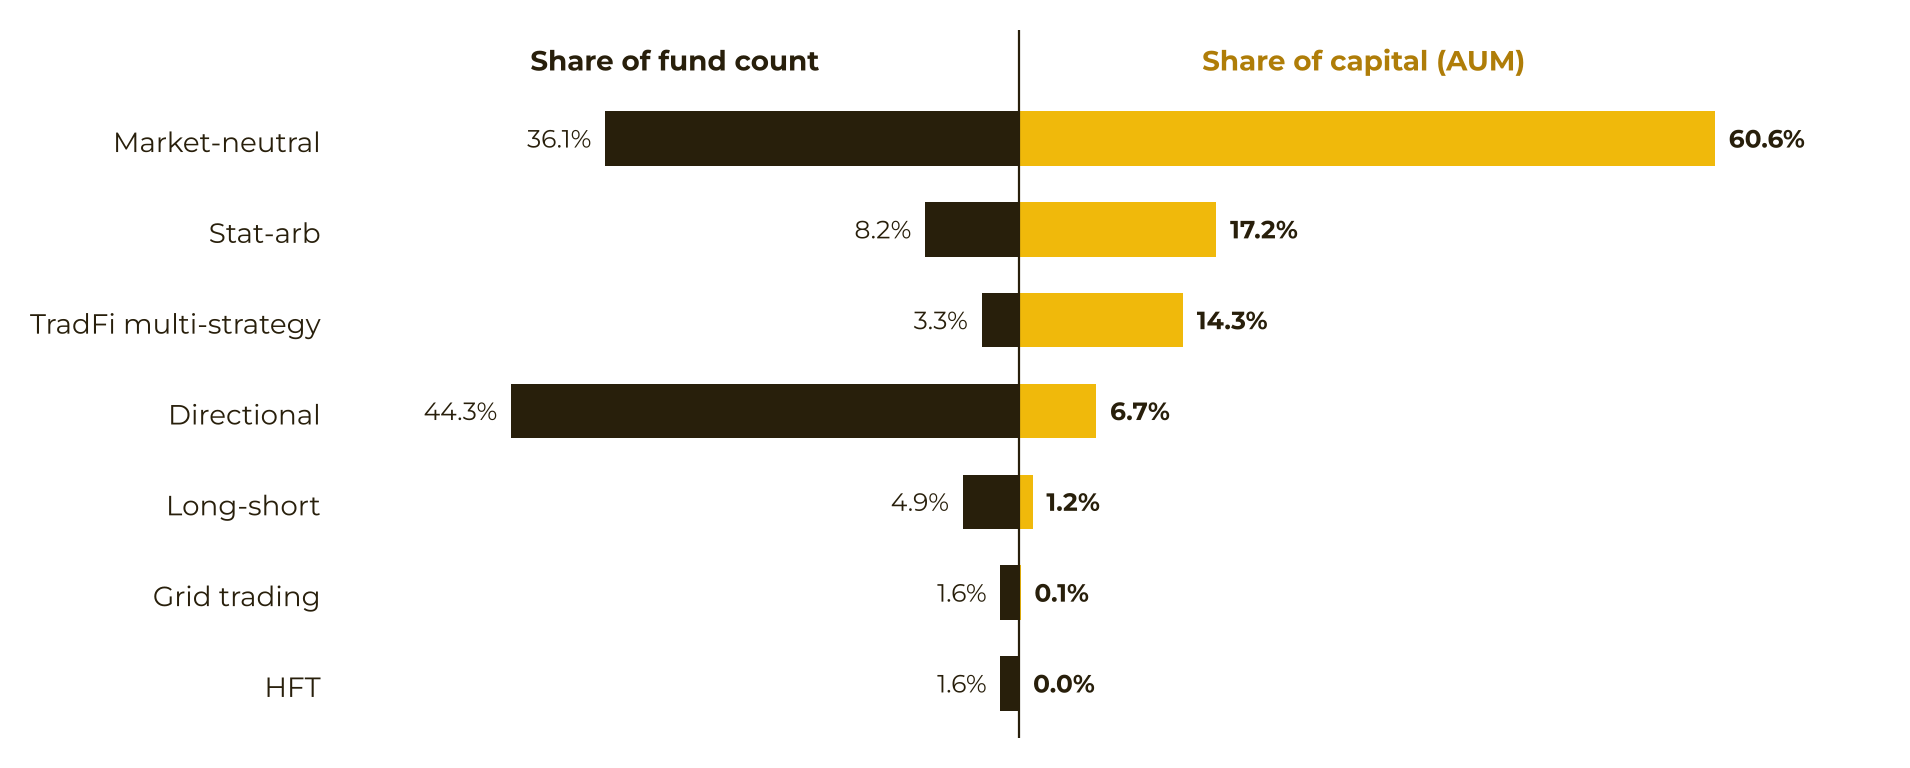
Directional strategies were the largest group by number of funds, at 44.3% of funds, but only 6.7% of platform assets. Market-neutral, statistical-arbitrage, and traditional-finance-style multi-strategy funds together held 92.1% of assets. Multi-strategy funds alone were 14.3%. In the summary figures, neutral-strategy funds were under half of the fund count and still absorbed 92.1% of platform capital. Their average ticket was about 11 times the average directional ticket.
Participation moved the same way. Market-neutral investor participation rose for two straight months and was up 30% cumulatively since May. Statistical-arbitrage participation more than doubled over that same stretch and held steady through October.
Supply and demand were therefore pointing in different directions: a long tail of managers tended to launch directional products, while platform assets concentrated in hedged strategies. Chronology here is not a proof that October’s price drop caused the split. The concentration was already the standing pattern, and it held through a down month for Bitcoin.
Two mandate styles met the same down month differently
The note tracks two growing mandate types and uses October’s volatility as a stress check, not as evidence of a reversal.
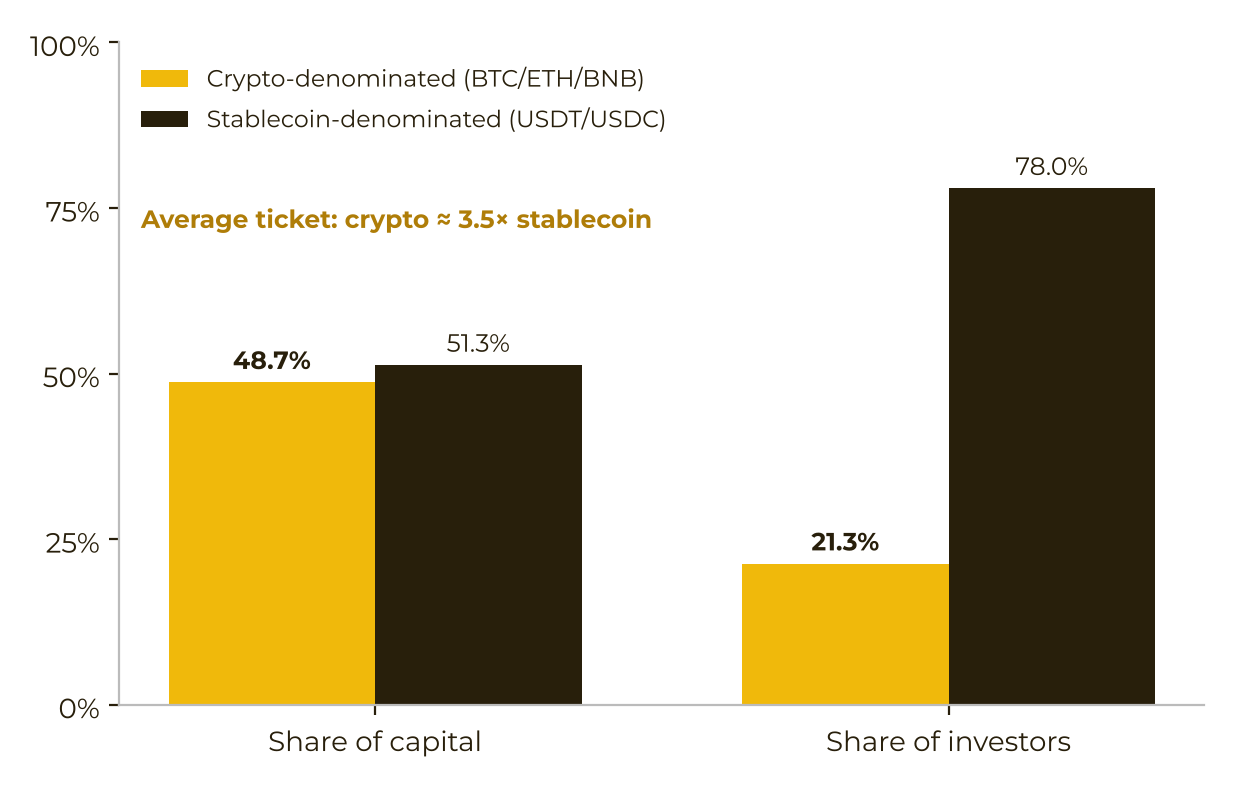
The crypto-native sleeve denominates funds in Bitcoin, Ether, or BNB. Nearly half of platform capital, 48.7%, sat in those funds. They accounted for about one-fifth of investors, and their average ticket was about 3.5 times that of stablecoin-denominated funds — the largest average subscription size on the platform. Allocators kept exposure to the underlying coins and outsourced the hedge to a manager. In October, coin-denominated physical holdings stayed stable. The pullback in US-dollar assets under management mainly moved with the Bitcoin price. The report does not document a liquidation wave.
The convergent sleeve is the traditional multi-strategy book. It was still the third-largest strategy by assets, at 14.3%. Investor participation in that sleeve fell 14% from September, from 21 people to 18. Binance Research treats that drop as selectivity inside a maturing market, not as a trend reversal: once a product resembled a familiar traditional structure, institutions would use it, but allocators still screened hard and some stepped back even when the strategy’s results were described as steady.
The report’s summary line is that hedged strategies remained dominant, coin-denominated mandates still produced the largest single tickets, and directional capital was still waiting for a clearer recovery signal.
Directional participation repaired, then faced October
Directional investor counts in the sample fell hard after returns bottomed in June, reached a low of 36 people in July, and recovered to 52 by October — back to the May level. The since-inception average return for directional funds improved from -11% in June to +3.7% in October. Those returns are simple averages of fund net asset values, as Capital Connect reports them, not a single fund’s result.
October was the first live test of that repair in the note. Bitcoin was down 7.2% on the month. Directional funds still averaged +1.9%, and market-neutral funds averaged +1.0%. Interviews described a repeated behavior rather than a one-month accident: allocators tended to cut directional exposure during drawdowns and add it back after volatility and liquidity had stabilized. That is reported interview pattern, not a demonstrated rule that every allocator followed in October.
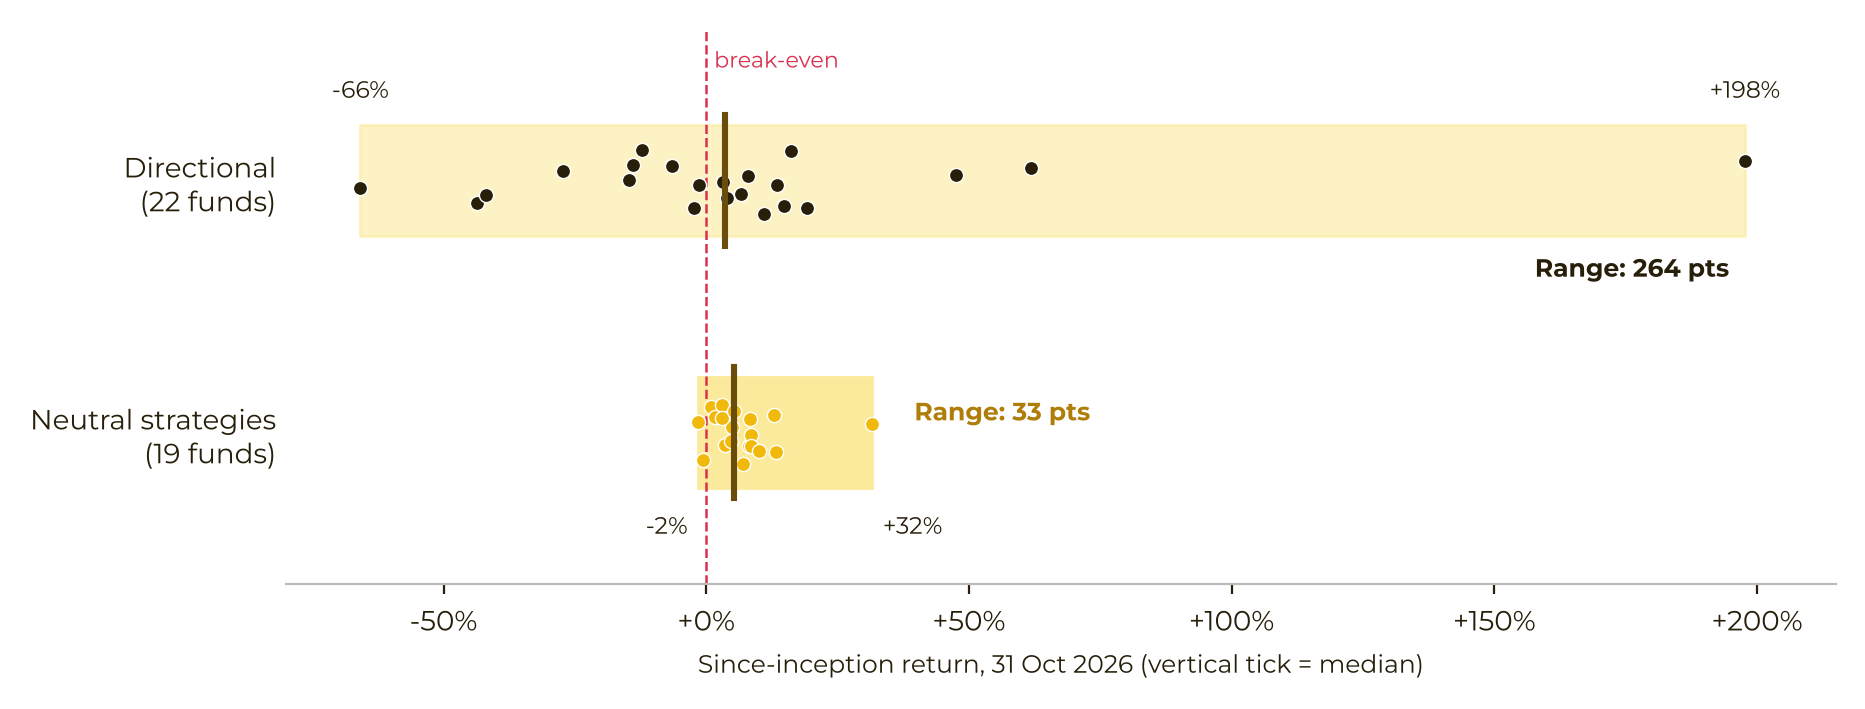
Dispersion stayed wide. The gap between the best and worst directional funds was about eight times the gap inside neutral strategies. The directional median was around +4%, and only 55% of directional funds were positive. Nine in ten neutral funds were positive. Neutral, in that distribution, covers market-neutral, statistical arbitrage, and traditional multi-strategy funds, and the comparison drops dormant funds and funds under $1,000 of assets. Even so, the top quarter of directional funds averaged +69% since inception. Allocators told the researchers they would still pay for alpha at that level if drawdowns stayed controlled.
What allocators and managers said unlocked a ticket
The interviews, from 29 October to 1 November 2026, are the report’s check on why the tables look like this.
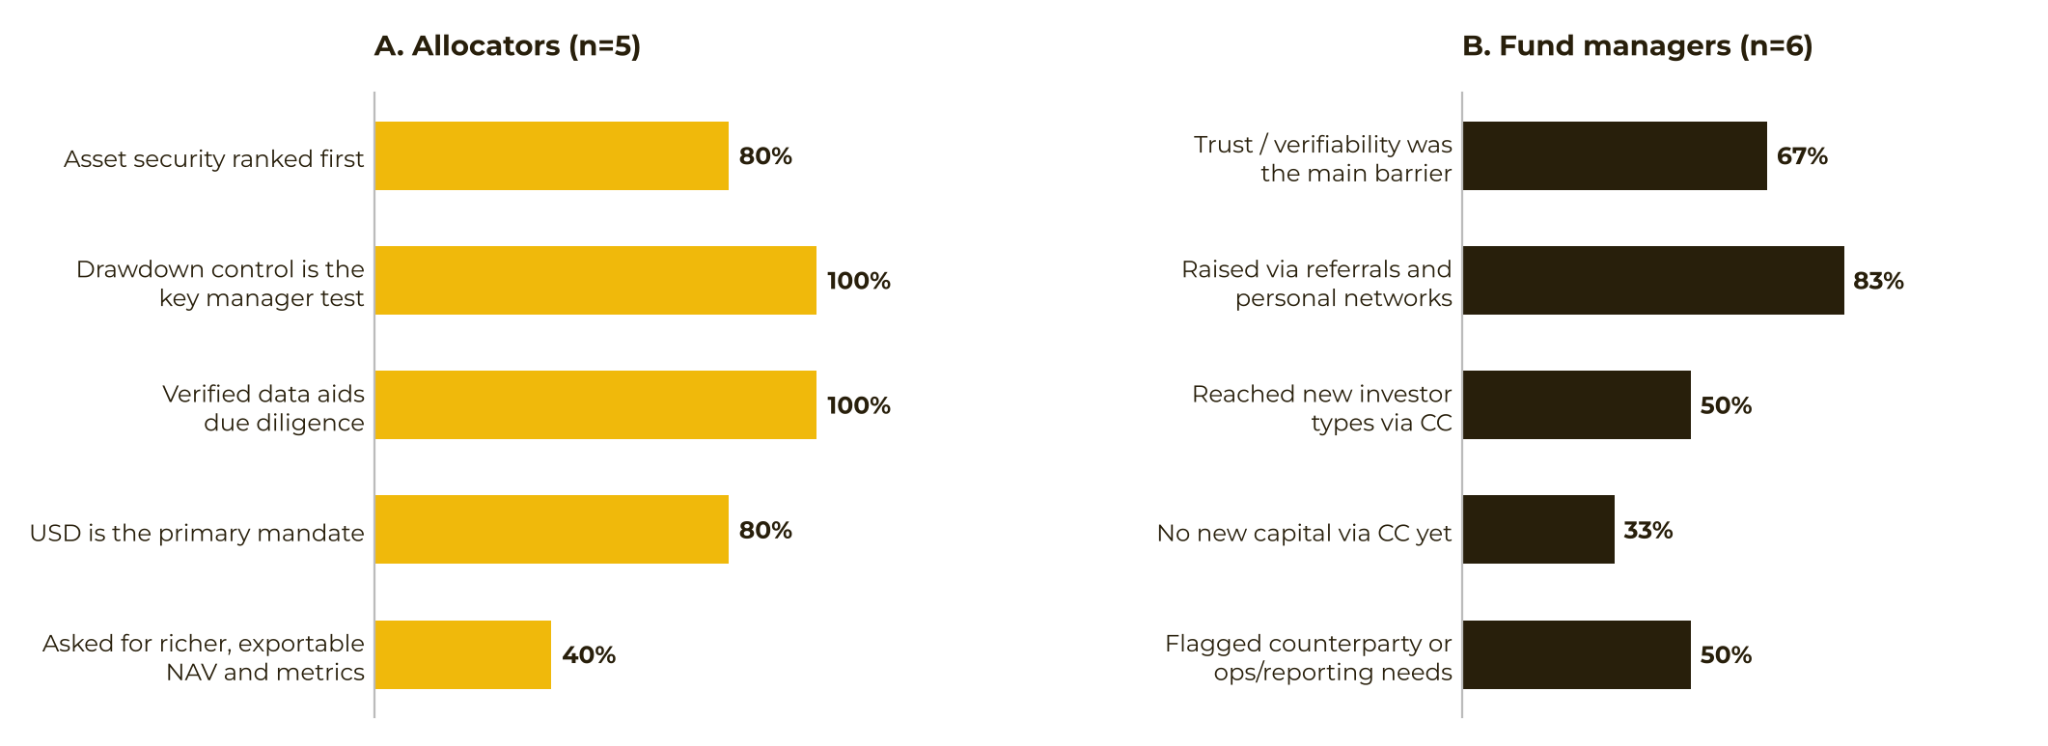
For allocators, asset security ranked first. Eighty percent placed it above historical performance and institutional reputation. Every allocator interviewed said verified data from inside the exchange materially strengthened due diligence. In manager selection they emphasized drawdown control more than a high headline return.
For managers, the fundraising obstacle was not an insufficiently bright return. It was the cost of trust. Track records were hard to cross-check, and KYC, anti-money-laundering, and counterparty compliance reviews slowed raising, so most capital still came through personal introductions. After a listing on the platform, some managers said they could reach a wider set of investors, compliant institutions, and pools built from smaller tickets.
The two sides of the market, in the note, sent the same signal: verifiability opened trust, and operating infrastructure could widen the channel. Binance Research does not claim that October’s positive average hedge-fund prints caused new institutional inflows, or that a further Bitcoin recovery would scale active funds by itself.
What the note does not claim
Binance Research states that the report is not a forecast, not investment advice, and not an offer to buy or sell any product, crypto asset, or strategy. Terms and views are offered for industry understanding, are not a formal legal opinion, and are not presented as Binance’s corporate position. Figures and views are as of the stated dates and may change. The authors say sources they consider reliable may be incomplete or inaccurate, and that any forward-looking remarks may not occur. Readers bear the risk of relying on them.
The October sequence is a chronology with attributed interpretations: a 7.2% Bitcoin decline, small positive average returns for directional and market-neutral funds on one platform, and a still-unscaled active industry next to about $111 billion in US spot Bitcoin and Ether ETFs. It does not establish why any individual fund made or lost money, and it does not show that passive dominance must persist or must reverse.