
A BlockBeats analysis published on November 3, 2026—the calendar day of the U.S. midterm vote—compared two markets that were not in the same place. U.S. equities were close to record highs. Bitcoin was still recovering from an earlier, sharp selloff. The piece set those positions against a long equity record and a much shorter Bitcoin record, then marked the limits of both.
Since 1950, the United States had held 19 midterms through 2022. In that tally, the S&P 500 was higher one year after voting day every time. Bitcoin had three complete midterm cycles. Its price was also higher a year later each time, but it fell in the weeks after every vote. The history can support a somewhat more optimistic view of both markets one year out. The path in between can look very different. How much of the record still applied to 2026 was left as an open question.
In the year before past midterms, the median maximum drawdown in U.S. stocks was 16%. Into this vote it was only about 9%, so there was less lost ground to reclaim. Bitcoin’s sample is three observations, and each midterm also fell about two to two-and-a-half years after a halving. The two calendars overlap. A later rise is not, by itself, evidence that the election caused it.
Equities: a complete one-year record, from a stronger start
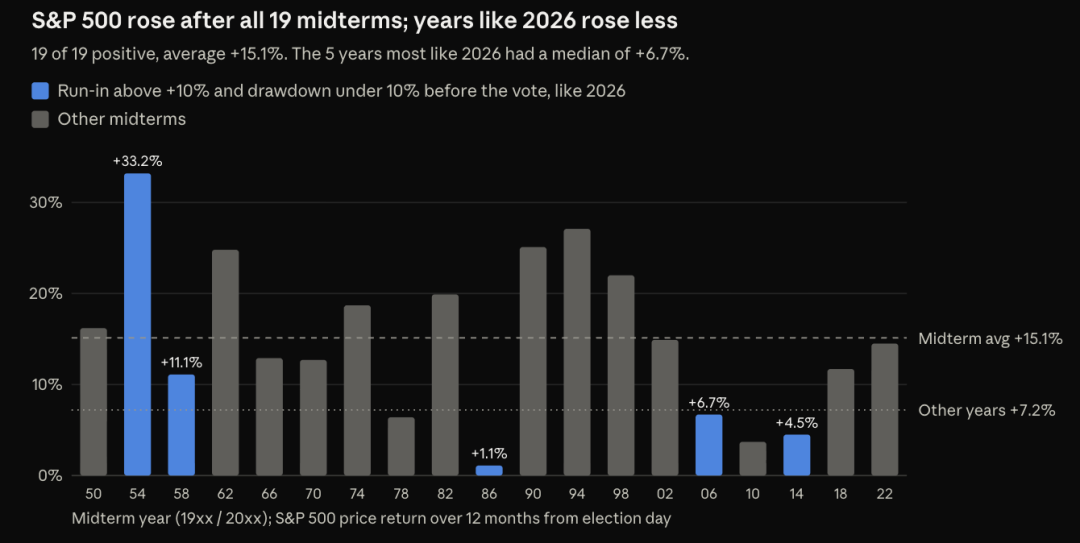
From 1950 through 2022 there were 19 midterms. In the 12 months after each vote, the S&P 500 rose every time. The average gain was 15.1%. The median was 14.5%. The weakest case still finished up 1.1%. IOSG calculated those figures from daily closing prices, as cited in the BlockBeats piece.
Other years were positive less often and by less. In non-midterm years, measured from a start in early November, the average return over the next year was 7.2%, and about 70% of those samples finished higher.
Most of the historical damage came before the vote. The median maximum drawdown in the year before midterms was 16%. Inside a six-month window around voting day set by the study, the market low arrived before voting day in 17 of the 19 elections.
The rise also often started before results were final. BlackRock’s analysis, as cited in the piece, found that U.S. stocks have historically tended to begin rising about a month before midterms, as the outcome grew clearer. By late October 2026, prediction markets put the chance of Democratic control of the House at about 93% and of the Senate at about 68%. A split between the presidency and Congress was already widely expected. It was not framed as an obvious election-day surprise.
An expected result does not mean every policy effect is in the price. It is more likely, the analysis argues, to produce a smaller immediate reaction than a surprise. Voting day is a time marker for watching the tape. It is not automatically a turning point.
The 2026 starting point also differed from the typical pre-midterm scar. In late October, the S&P 500 was only about 3% below the record close set on October 6, and the maximum drawdown over the prior year was about 9%. There was not much ground left to make up.
Five earlier midterms matched two conditions at once: a pre-election gain of more than 10%, and a drawdown of less than 10%. Those votes were in 1954, 1958, 1986, 2006, and 2014. Returns over the following year ranged from 1.1% to 33.2%. The median was 6.7%.
That range matters more than the median’s apparent precision. The cases show that a strong market can keep rising after an election. They do not supply a reliable return target for 2027. The original Figure 1 compared 12-month S&P 500 returns after each midterm and marked those five episodes for comparison with 2026. Historical experience leans constructive. Any further advance would still need earnings and the rate backdrop. A repeated sequence is not the same thing as a cause.
Bitcoin: higher a year later, after a hard stretch
Bitcoin’s history is shorter, and holding through it has been harder.
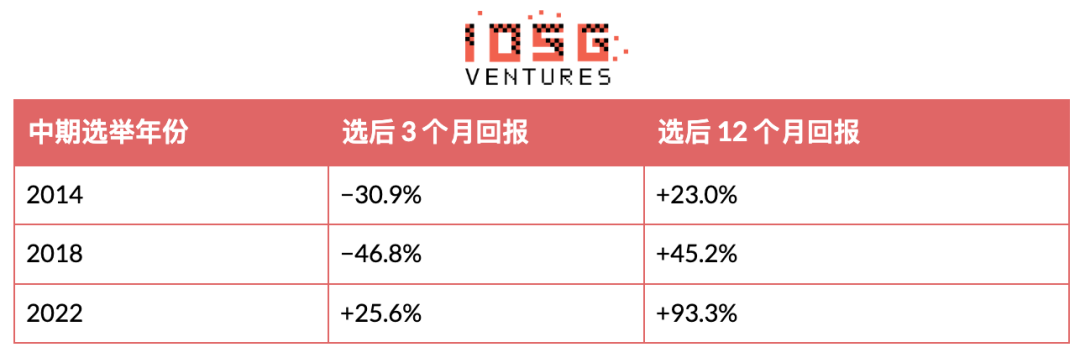
In the three complete cycles—2014, 2018, and 2022—BTC fell in the weeks after voting day, then stood higher one year after the election. The 2022 decline was the shorter one: three months after that vote, BTC was already up. Short-term results across the three cycles differed widely. IOSG built the comparison from CoinMetrics BTC PriceUSD data.
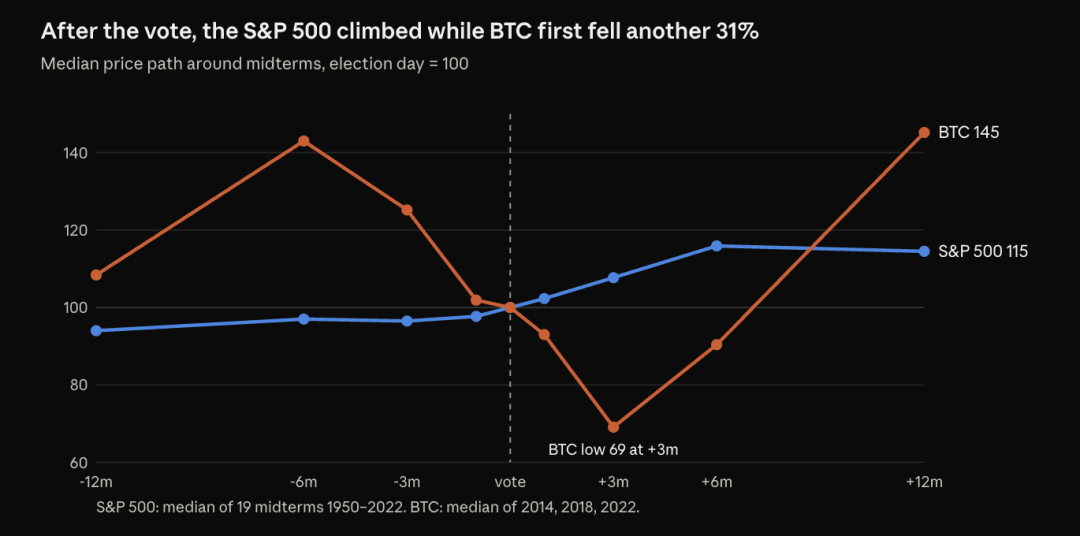
Binance Research has put Bitcoin’s average gain in the year after midterms at about 54%, close to the 53.8% average in this sample. The path is the point. The median return about three months after the vote was roughly −31%. About twelve months later it was roughly +45%. Someone who was eventually right on direction could still have sat through a large loss first.
Figure 2 in the original analysis plotted median performance around midterms with voting day indexed to 100. The S&P sample covers the 19 elections from 1950 to 2022. The Bitcoin sample covers the three elections from 2014 to 2022. The lines only connect selected observation points. They are not a forecast.
Those samples cannot isolate an election effect. Each of the three midterms also landed about two to two-and-a-half years after a Bitcoin halving, and each fell in a bear-market phase. The November 2026 election sits on a similar clock: about two-and-a-half years after the April 2024 halving. Three observations, with two cycles stacked together, cannot show whether the election itself materially changed the pattern.
The median curve is not a price path. It pools different years. It is not a sequence any one holder lived through. Laying it onto the price around November 3, 2026 would invent a precision the data do not have.
The holder base has changed as well. Spot ETFs and corporate-treasury capital can add demand. The same channels can pass through redemption pressure, financing pressure, and shifts in risk appetite. Being constructive on the next year does not rule out further downside in the near term. The samples do not say when a decline ends.
Policy is the direct crypto channel
For crypto, the most direct election link is policy. With divided government already the widely expected setup, the sharper question is how the next Congress sets legislation, oversight, and agency appointments.
The CLARITY Act is the concrete example of that uncertainty. On September 15, the Senate failed a procedural motion to end debate and advance the bill, 49 in favor and 50 against. A motion to reconsider was then filed, so the bill was stalled rather than finally dead. The Senate did not hold a second vote before the election recess. For this Congress, the only window left was the lame-duck session after the election and before the new Congress is seated.
The next Congress decides committee leadership, legislative priorities, and the terms of any renegotiation. What follows was presented in the original as scenario analysis, not a prediction of the legislative result. A Republican hold of the Senate could be more favorable to industry-preferred policy. It would not guarantee passage. Democratic control of Congress would not, by itself, rule out bipartisan legislation.
Regulators can still act under existing authority. Rulemaking and staff guidance may settle some specific questions. Their reach and durability are not the same as a statute.
One election result can hit equities and crypto through different channels. If the presidency and Congress are split, new fiscal spending plans may be constrained. That can ease some upward pressure on bond yields and support equity valuations. For crypto firms, the same gridlock can extend the wait for settled market-structure rules. Financial markets could welcome tighter limits on spending while crypto is disappointed by the lack of a stable legal framework. Neither result is necessary. Even if Congress is stuck, the executive branch and regulators can still move policy.
What would have to carry a move into 2027
The author’s base judgment was offered as an interpretation after looking at the history, not as a forecast read straight off the averages: the equity outlook was broadly constructive, with a bumpy path; Bitcoin’s near-term path was harder to call.
For equities, the supports named were continued earnings growth and easing pressure from bond yields. A rally that spread from the large technology companies leading the index to more companies would be more convincing. Persistently high inflation, or earnings that miss expectations, would weaken that case no matter which party controlled Congress.
For Bitcoin, the watches were whether spot ETFs kept attracting capital, whether liquidity improved, and whether earlier gains held if the broader market weakened. Sustained outflows, or a fresh rise in financing pressure, would argue against treating a bear-market low as already past. The piece does not claim that low had been made.
Three items were singled out:
- The Federal Reserve meeting on December 8–9, 2026. On October 28 the Fed held the policy rate at 3.75%–4.00%, with two members dissenting, and markets had begun to price the possibility of a rate increase in December. New projections would help show whether pressure from bond yields was easing.
- Earnings and breadth: whether profit growth and price gains spread from the companies leading the index to a wider set of firms.
- Bitcoin flows: whether institutional demand held across consecutive weeks, rather than clustering on single trading days.
The election result belongs beside those indicators. It does not replace them.

What the record does not settle
The starkest finding is how consistently U.S. stocks were higher a year after midterms. The caveat is just as clear. Into the 2026 vote, equities were already strong, the pre-election drawdown was shallower than the old 16% median, and the five closer analogues produced next-year returns from 1.1% to 33.2%.
Bitcoin’s lesson is different. In three complete cycles the price was higher a year later, and in each of them holders first lived through a further decline. That is a statement about path risk. It is not a forecast of the next cycle. Because those elections also sat in a post-halving window, the vote cannot be separated cleanly from the rest of the calendar.
Whether a recovery could still be in place in 2027, the analysis concluded, would depend on what followed in earnings, liquidity, and capital flows—not on the midterm date alone.
This account follows reporting published by BlockBeats on November 3, 2026, at 15:35 (UTC+8): the original article. Chart sources in that piece are attributed to IOSG, using daily closes and CoinMetrics BTC PriceUSD, with further reference to BlackRock and Binance Research. Scenario language there is not a legislative or price prediction.