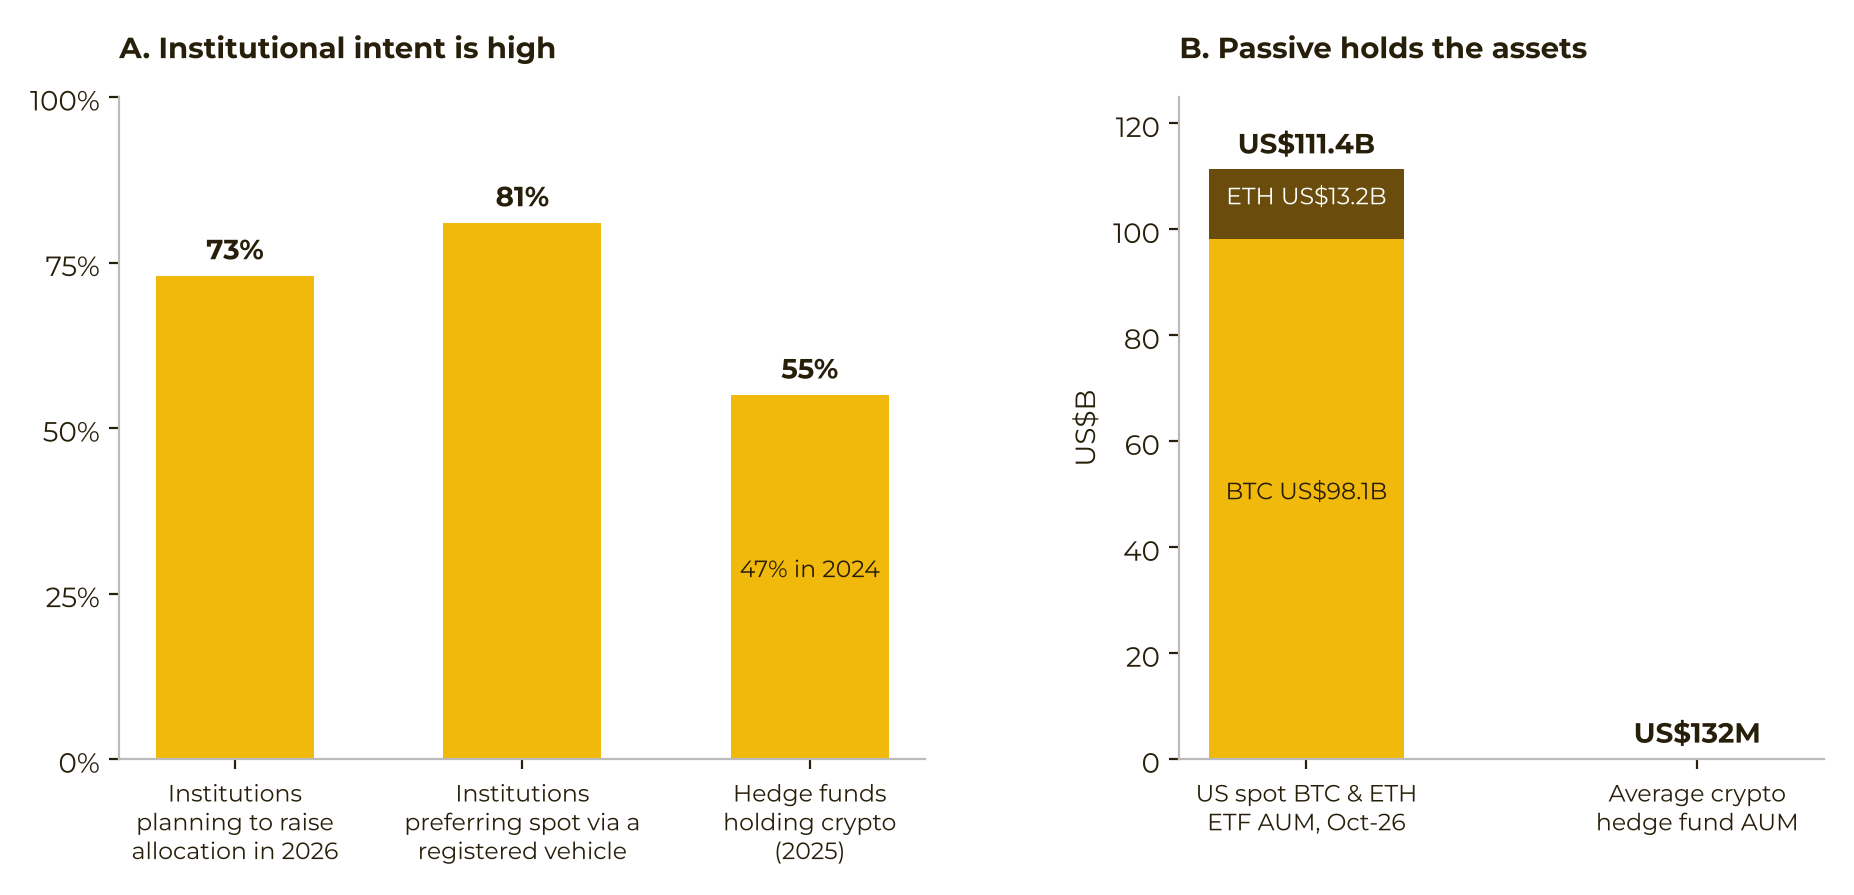
On 11 November 2026, ChainCatcher published a Binance Research note written by Kim Lim and Jasper Jin and compiled in Chinese by TechFlow. The figures run through 31 October 2026. The size gap is stark. U.S. Bitcoin and Ethereum spot ETFs together held about $111 billion. Crypto hedge funds averaged $132 million, and 91% were under $1 billion.
Bitcoin fell 7.2% in October. Directional funds on Binance’s Capital Connect still averaged +1.9% that month. The note treats the month as a stress test of allocation behavior, not as a cycle turning point.
Passive products scaled. Active funds did not.
Binance Research argues that institutional willingness to hold digital assets was already firm. A 2026 EY-Parthenon and Coinbase survey — identified in the note’s chart sources as the March 2026 institutional digital-asset survey — found that 73% of institutions planned to raise digital-asset allocations during the year. An AIMA and PwC report, identified in those sources as the 2025 global crypto hedge fund report, found that 55% of traditional hedge funds held crypto assets, up from 47% in 2024.
The note says most of that demand went into passive vehicles. Among surveyed institutions, 81% preferred registered, compliant products for spot exposure. By the end of October 2026, combined assets in U.S. Bitcoin and Ethereum spot ETFs were about $111 billion. Against that, crypto hedge funds averaged $132 million, and 91% were smaller than $1 billion.
The authors state their view directly: the split reflects infrastructure, not a lack of manager ability. An ETF, they write, bundled custody, audit, daily net-asset-value pricing and reporting that institutions already used. Active crypto strategies had not matched that level of institutional integration.
Size of position showed the same restraint. Among traditional hedge funds that held crypto, more than half allocated less than 2% of total assets. At the same time, 60% of institutions planned to raise exposure above 2% within a year. The note treats that as a limit of existing investment infrastructure, not as evidence that interest was missing.
The stated bottleneck is discovery, not talent
If talent were scarce, the authors say, market practice would close the gap. They locate the constraint in finding managers and verifying them.
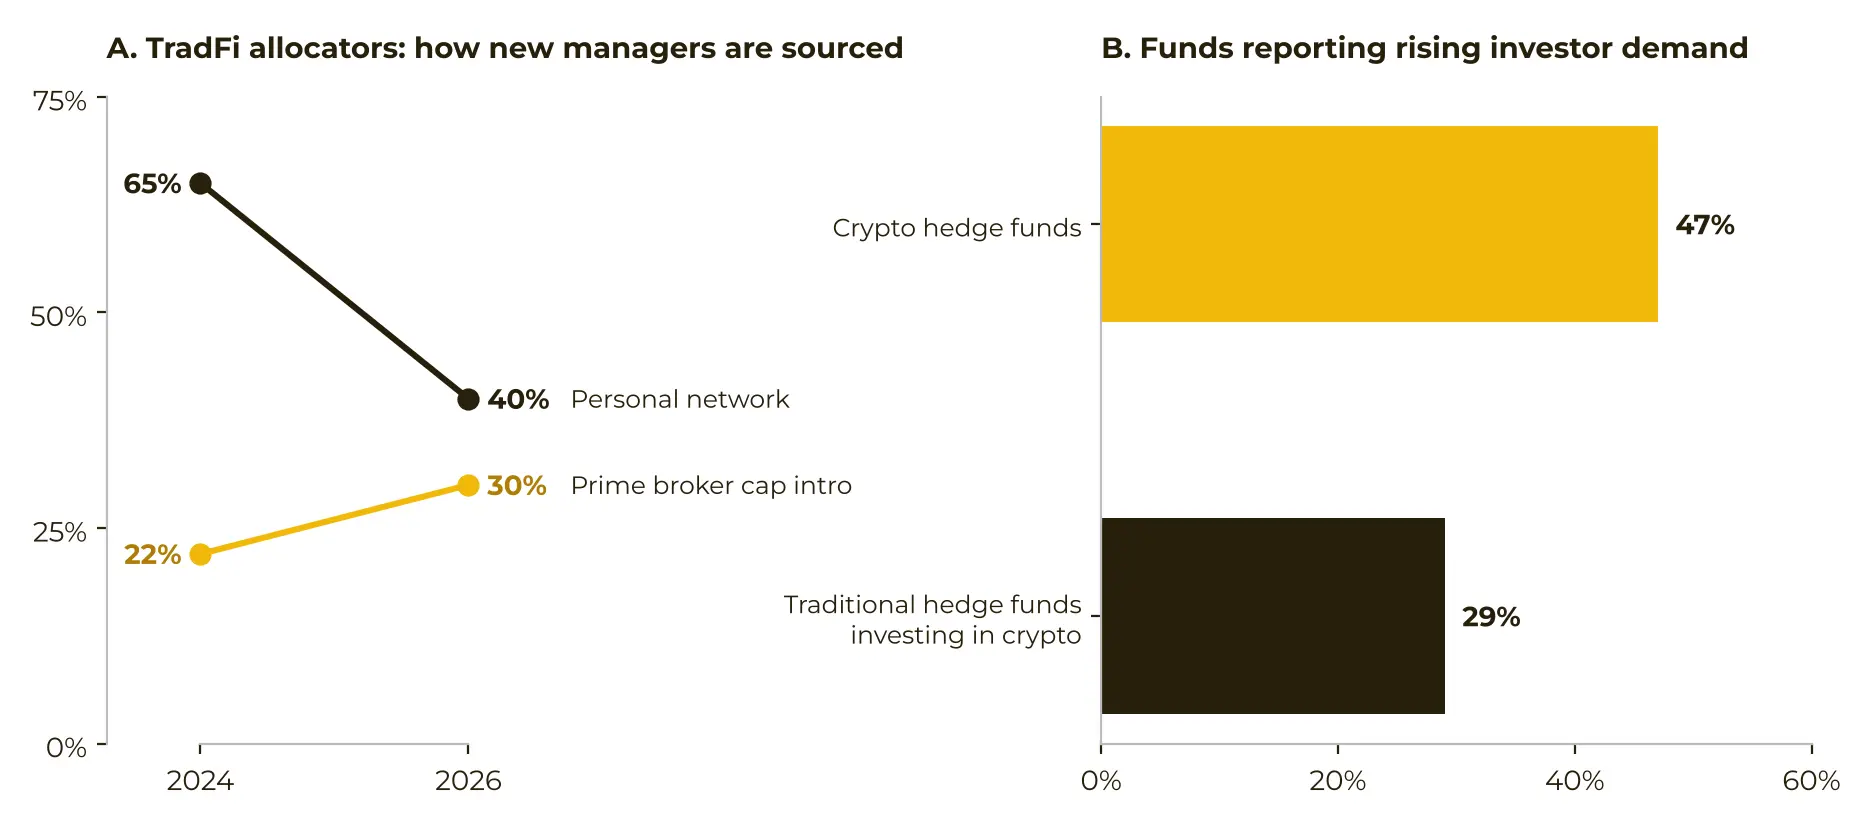
Traditional markets were already standardizing that path. An AIMA and Marex survey, cited through the note’s 2026 emerging-manager survey reference, found that allocator reliance on personal networks fell from 65% in 2024 to 40% in 2026. Over the same period, the share using prime-broker capital-introduction channels rose from 22% to 30%.
Crypto, in the note’s account, still lacked a matching standard channel. Capital still depended heavily on Telegram groups, offline conferences and introductions from people the allocator already knew. Without a shared performance-disclosure and benchmark framework, investors could not compare managers on the same terms. Institutions also had trouble checking audited financial statements, custody arrangements and service-provider qualifications.
That friction constrained both sides. Among crypto hedge funds, 47% said investor demand was rising, compared with 29% of traditional hedge funds involved in crypto assets. Even so, family offices and high-net-worth individuals remained the main providers of capital to crypto funds. Only one-fifth of crypto hedge funds listed pensions, endowments or sovereign wealth funds as a primary investor type. That was up from one-ninth a year earlier, but those institutions were not yet the core base.
The traditional shift is only a partial parallel. There, personal networks were losing share to prime brokers. In crypto, the note says the standardized route was still largely absent, so the resemblance stops at the problem rather than the remedy. Capital Connect, described as Binance’s regulated platform for discovering and allocating to crypto funds, is presented as one attempt to fill the gap. The preference figures that follow are observations on that platform. The note says a discovery layer reveals a preference; it does not create one.
More directional funds, more neutral capital
Strategies on Capital Connect must be disclosed publicly, and results are measured on a common standard. The October data continued the earlier pattern.
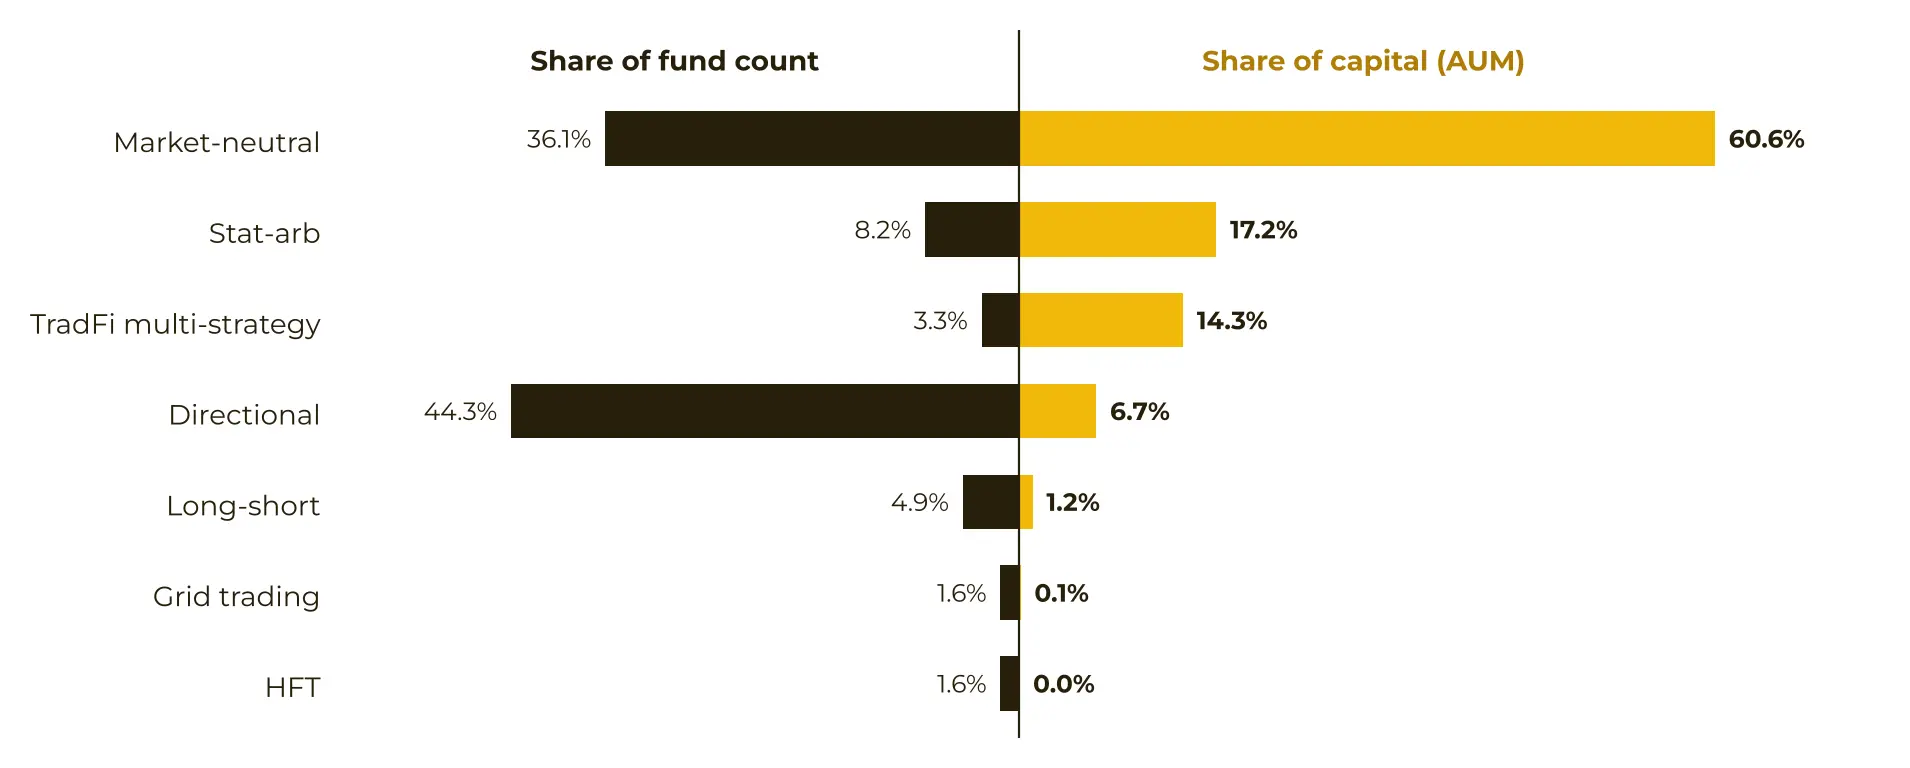
The note groups market-neutral, statistical-arbitrage and traditional-finance-style multi-strategy funds as the neutral set. That set was under half of funds by count and held 92.1% of platform assets. Multi-strategy alone accounted for 14.3%. Directional strategies were the largest group by number, at 44.3% of funds, but only 6.7% of assets under management. The average neutral ticket was about 11 times the average directional ticket. Capital was not simply following whichever strategy had the most products.
Participation moved the same way. Market-neutral investor participation rose for a second consecutive month and was up 30% in total since May. Statistical-arbitrage participation more than doubled over that period and held steady through October.
Manager supply and allocator demand pointed in opposite directions. A long tail of managers tended to offer directional products, while platform capital concentrated in hedged strategies.
Two mandates under the October decline
Two allocation styles were growing at the same time. October showed they did not respond alike.
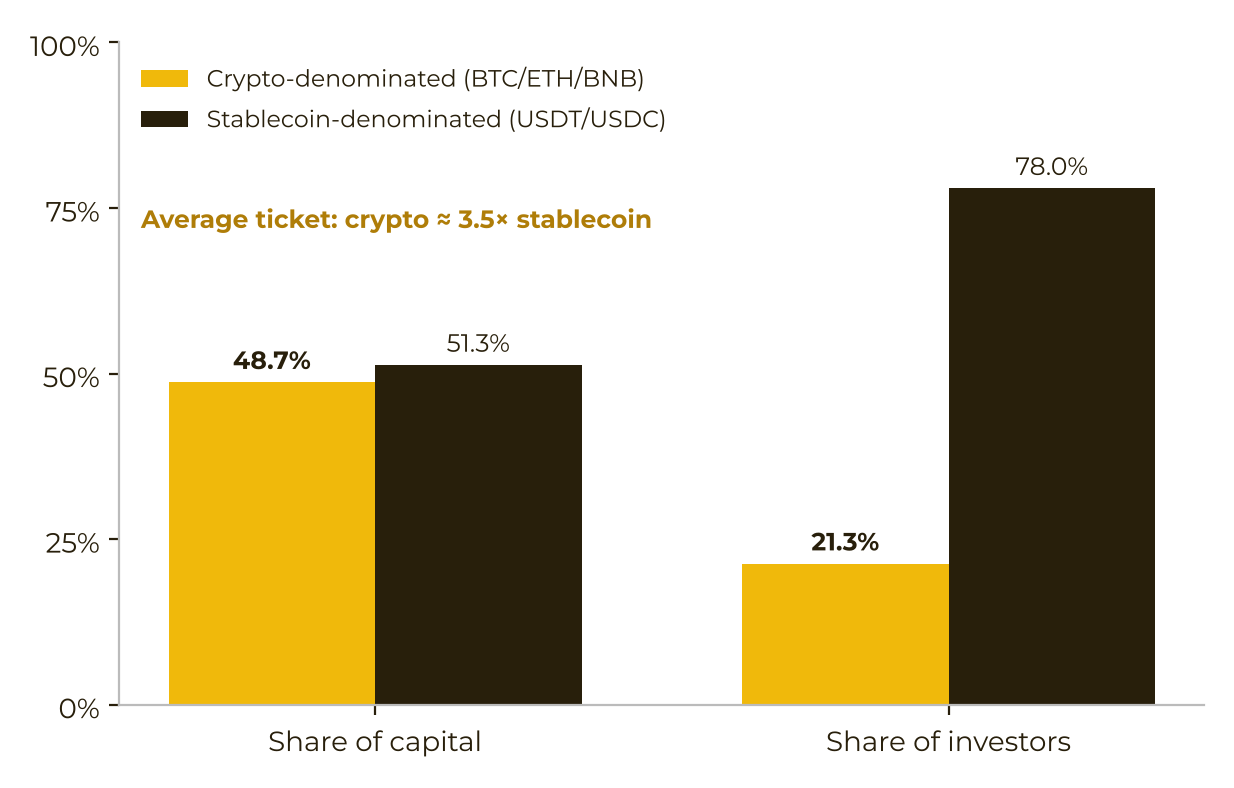
The first is crypto-native. Close to half of platform capital, 48.7%, was in funds denominated in BTC, ETH or BNB. Those funds took in about one-fifth of investors, but the average ticket was about 3.5 times that of stablecoin funds. Allocators kept the underlying-asset exposure and outsourced the hedge. In October, coin-denominated physical holdings stayed stable. The pullback in dollar-denominated assets under management mainly moved with the Bitcoin price. The update says coin-denominated mandates still contributed the largest single tickets.
The second is convergent. Traditional-finance-style multi-strategy funds were still third by capital, at 14.3%. In October, investor count in that strategy fell 14% from the prior month, from 21 people to 18. The authors read this as a maturing market rather than a reversal of the trend. A familiar product structure drew institutions in, they write, but allocators kept screening, and some reduced participation for a time even when results were steady.
Directional participation recovered on the calendar
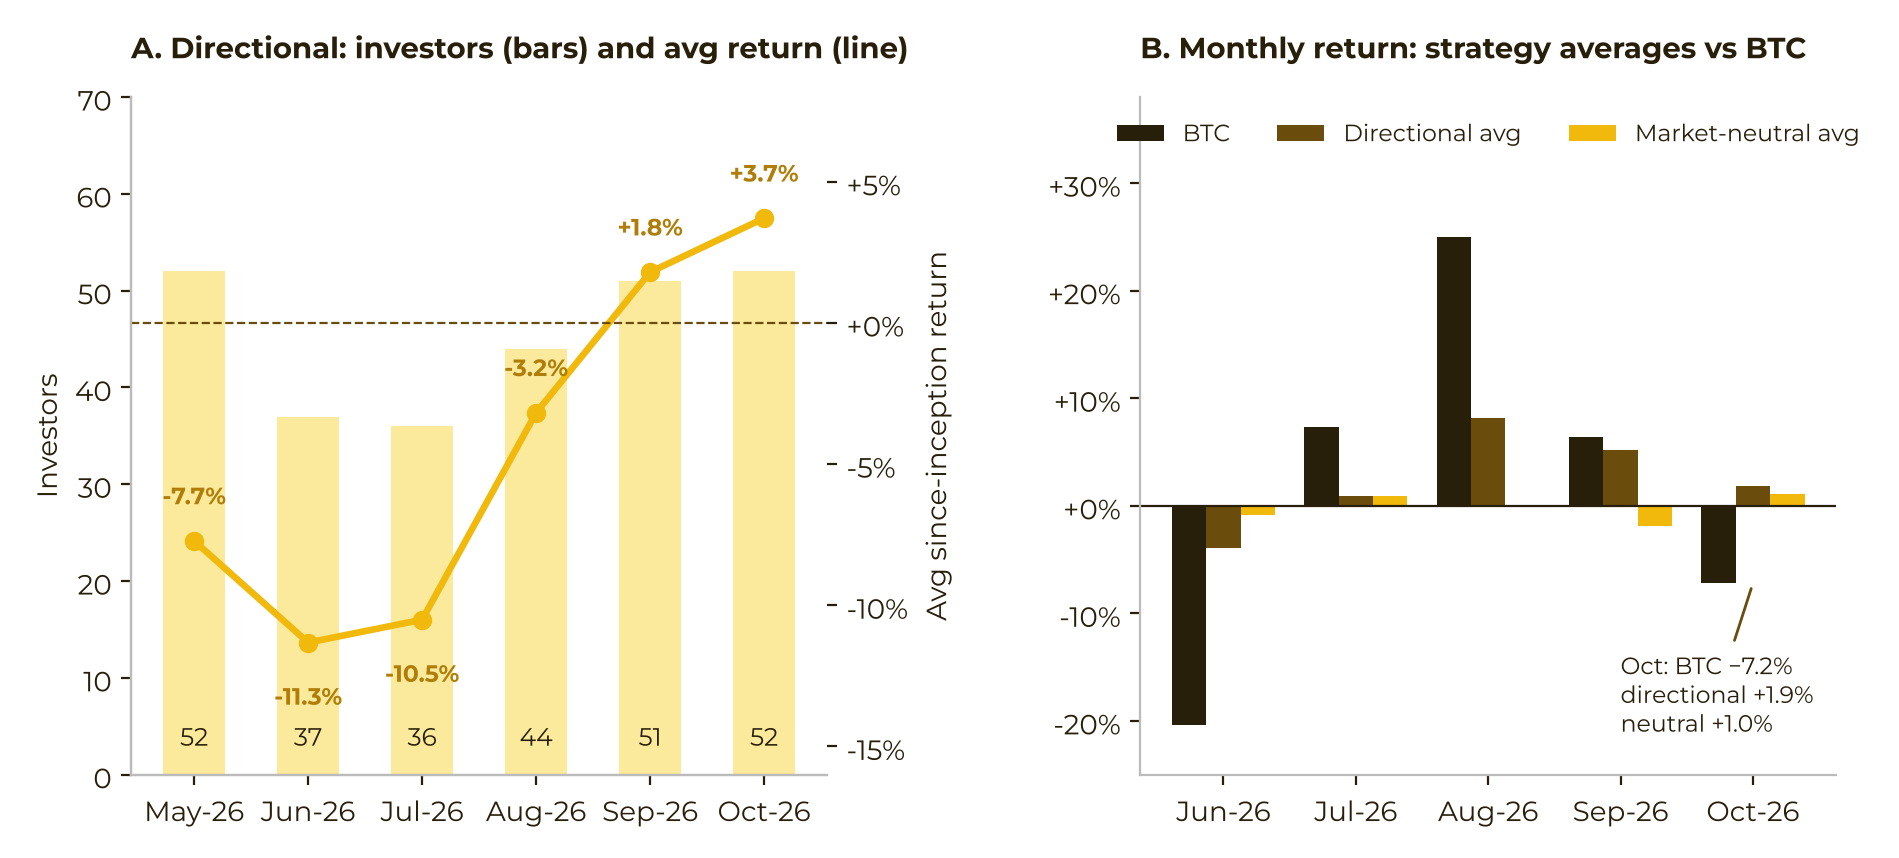
The path of directional participation is dated in the note. After returns bottomed in June, investor numbers in the sample fell sharply and reached a low of 36 in July. By October the count was 52, back to the May level. The average since-inception return of directional funds improved from -11% in June to +3.7% in October.
The note calls October the first live test of that repair. Bitcoin fell 7.2%. Directional funds still averaged +1.9% for the month, and market-neutral funds averaged +1.0%. Interviews described a repeated pattern rather than a measured liquidation wave: allocators typically cut directional exposure during drawdowns and added again after volatility and liquidity stabilized. The same update says directional capital was still waiting for a clearer recovery signal. A restored headcount is not, by itself, evidence that a new advance had started.
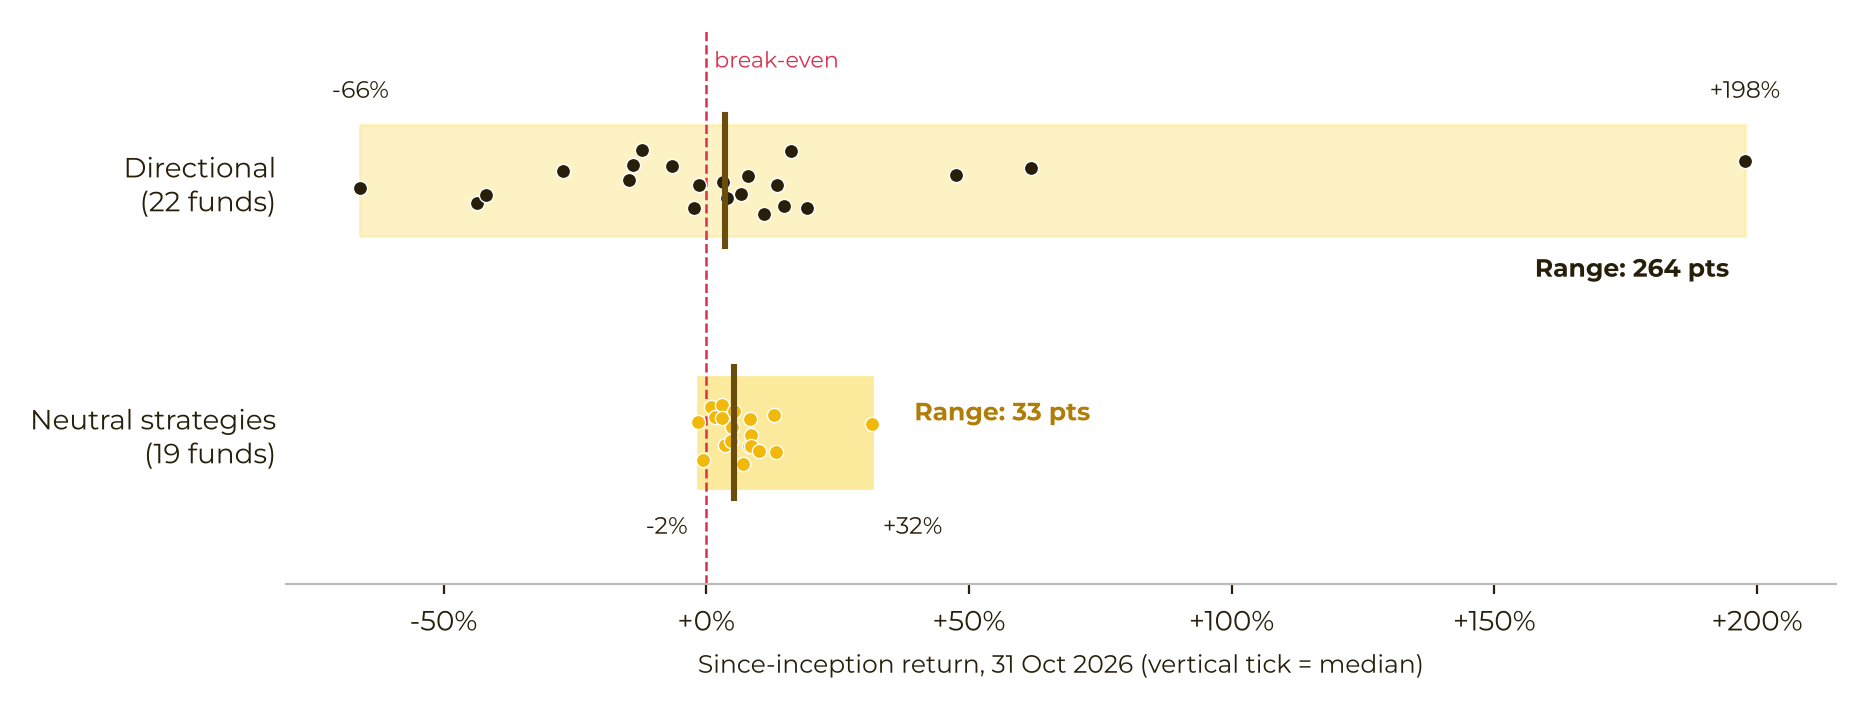
Dispersion remained wide. The gap between the best and worst directional funds was about eight times the gap among neutral strategies. The median return was around +4%, and only 55% of directional funds were positive, against nine in ten neutral funds. The return-distribution exhibit, as of 31 October 2026, is described as a simple average of fund net asset values, excluding dormant funds and funds managing under $1,000. In that exhibit, neutral covers market neutral, statistical arbitrage and traditional-finance multi-strategy. Separately, the top quarter of directional funds averaged +69% since inception. Allocators told the researchers they would still pay for alpha at that level if drawdowns stayed under control.
Interviews: security and verification before the return
To test the pattern, Binance Research interviewed Capital Connect allocators and the trading teams running funds from 29 October to 1 November 2026. The answers are interview findings, not a full-market census.
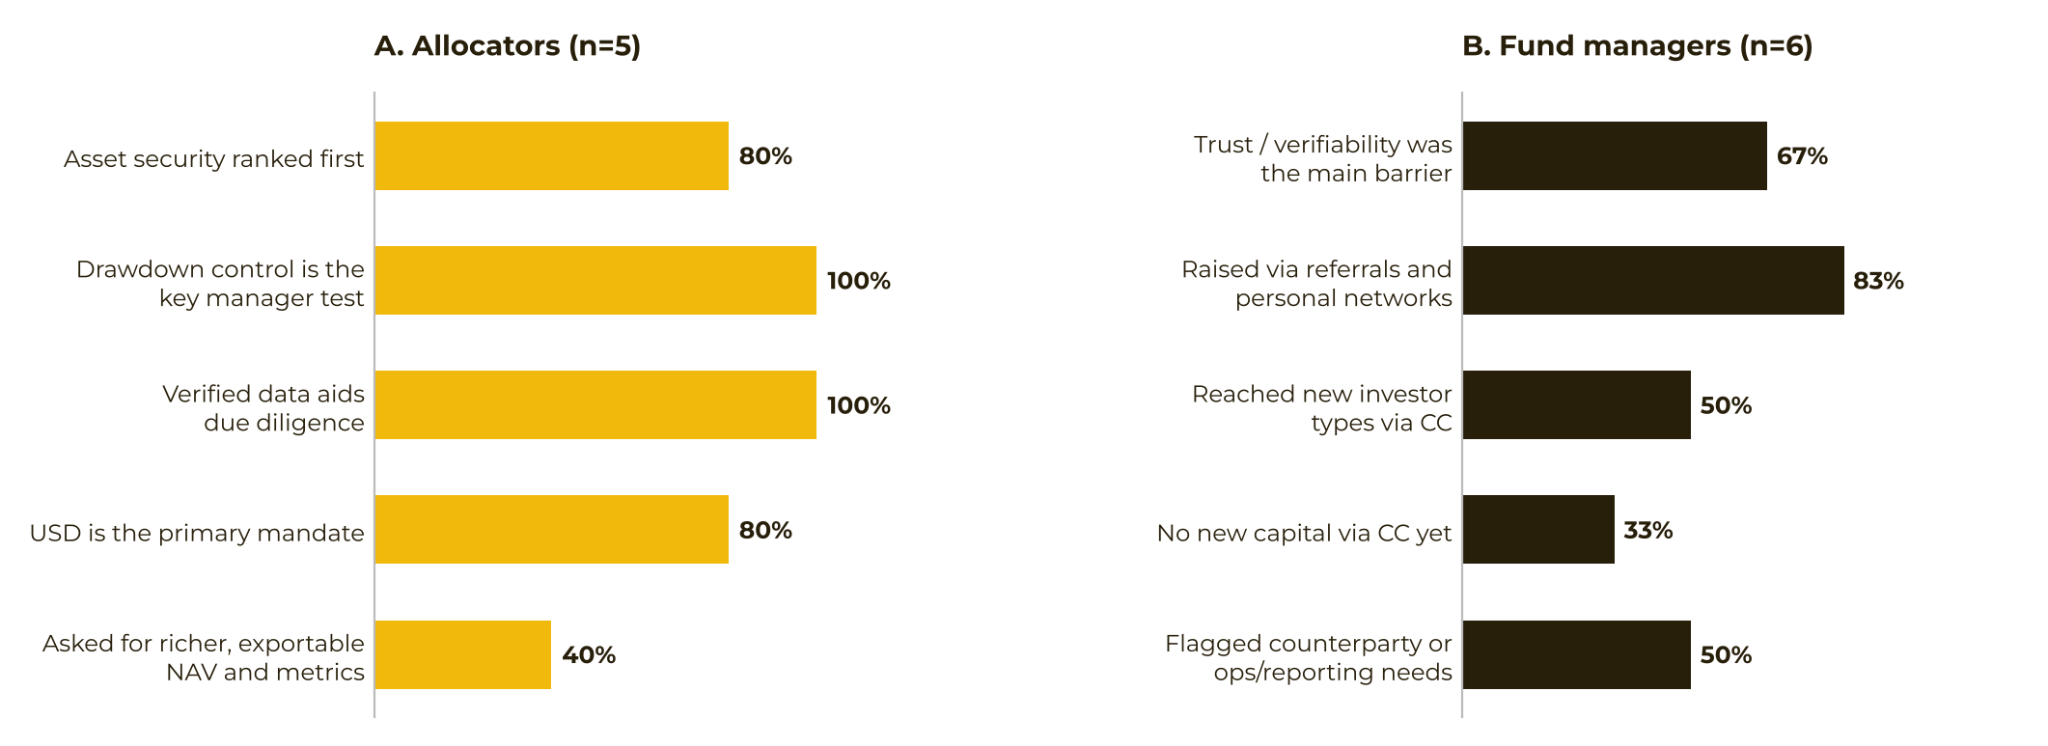
For allocators, asset security came first. Eighty percent ranked it above track record and institutional reputation. Every allocator interviewed said verified internal data from the exchange materially strengthened due diligence. In judging managers, they put more weight on controlling drawdowns than on a high headline return.
For managers, the obstacle to raising capital was not an unimpressive return. It was the cost of trust. Past results were hard to cross-check, and KYC, anti-money-laundering review and counterparty compliance checks slowed fundraising, so most capital still depended on personal referrals. After listing on the platform, some managers reached a wider investor set, compliant institutions and pools assembled from smaller tickets.
The note says both sides sent the same signal: verifiability opened trust, and operating infrastructure could widen the channel. It also says the core conclusion still held in a month when Bitcoin fell about 7%. Hedged strategies remained dominant, coin-denominated mandates still contributed the largest tickets, and directional capital was waiting for a clearer recovery signal. Allocators and managers agreed that what moved an allocation was verifiability, not the return number by itself.
What the report does not establish
The original states that it is not a forecast or investment advice and not an offer to buy or sell any trading product, cryptocurrency or strategy. It says its information comes from proprietary and non-proprietary sources Binance Research considers reliable, that those sources may be incomplete, and that accuracy is not guaranteed. Any forward-looking remarks may not be realized. This account adds no price target, no flow estimate and no liquidation figure the source does not report, and it does not treat October 2026 as a top or a bottom.
Original article, published 11 November 2026 at 22:09 (UTC+8): ChainCatcher.